What we do
The Dashboard
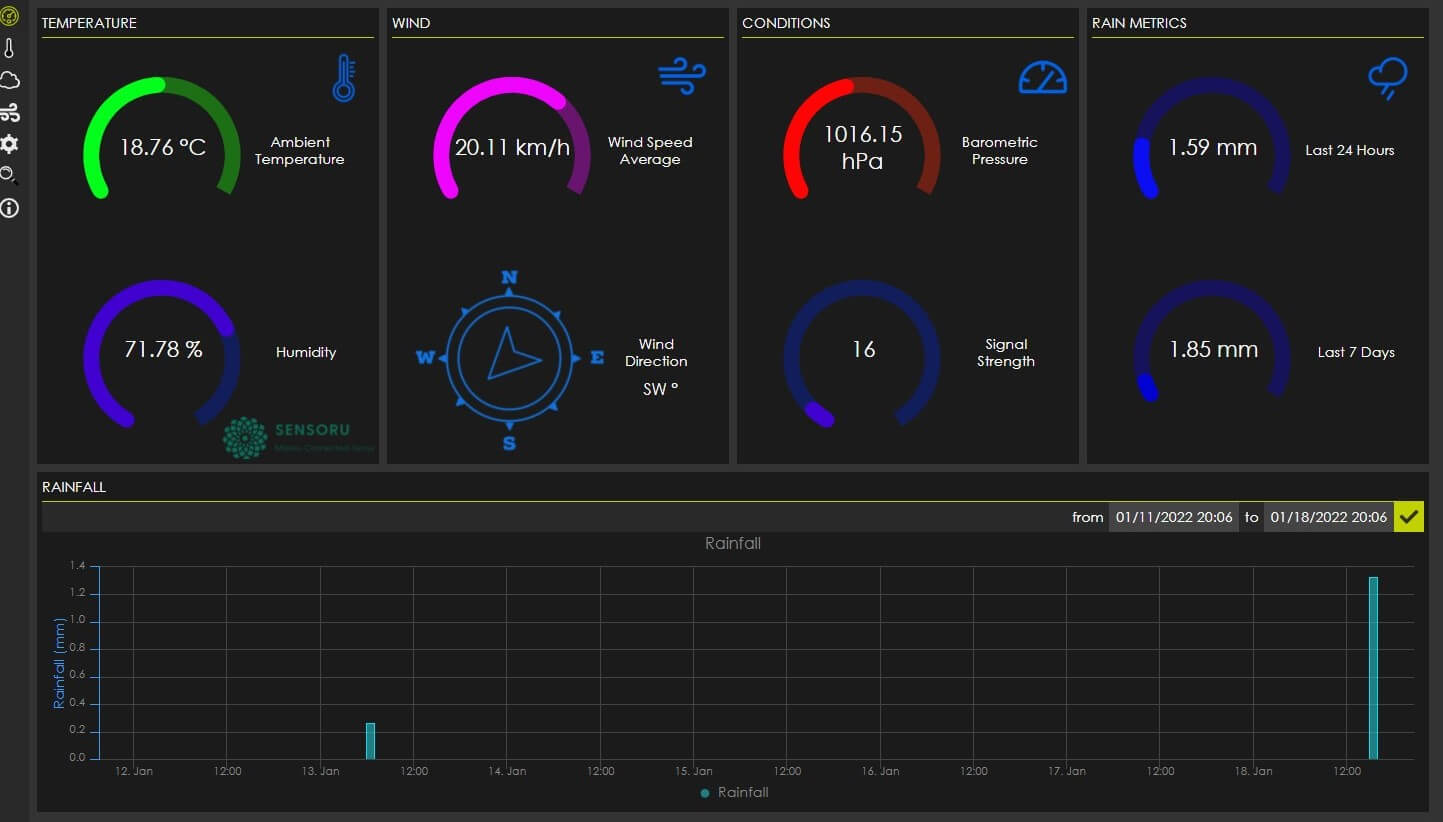
Our customers are provided with customized online dashboards, which can be viewed on most web browsers or mobile devices.
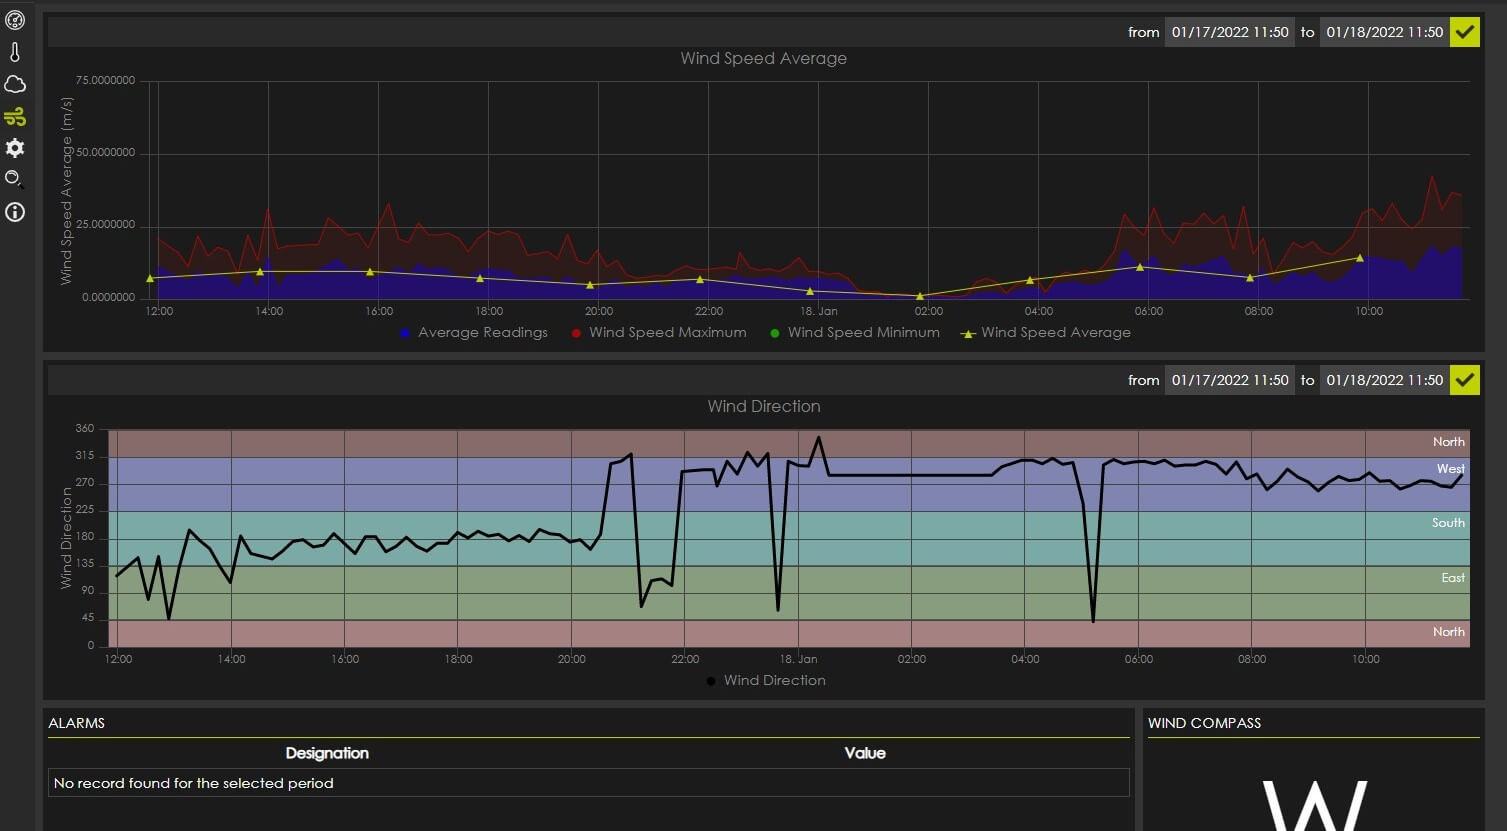
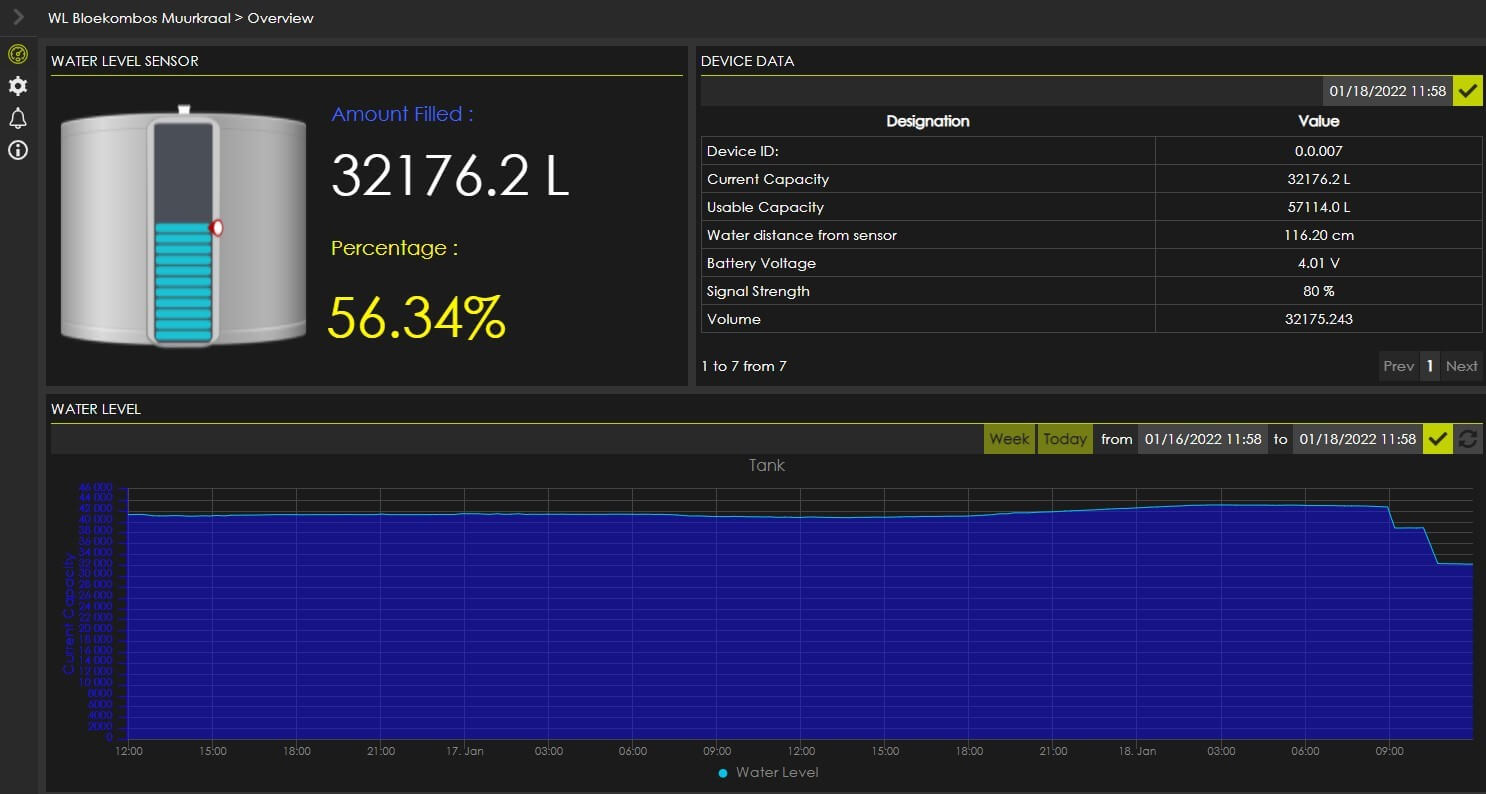
Depending on the type of sensors connected to the dashboard and their parameters, customers can access various graphs and gauges on the dashboard.
The gauges on the dash show the raw data or conditions from the last post, such as total rainfall, weight measured with a load cell or scale, or salinity of the water at the borehole.


The Data
Data is presented as graphs over a predefined period. The user can compare changes over hours, days, months, or even years. You can export your data as an Excel spreadsheet, a PDF document, or an image file.
You can set up alerts or notifications to notify users via the app, email, or SMS when certain predefined conditions are met, or critical thresholds have been reached.
Thus, the user can take decisive action before it becomes a critical situation. Whether an alarm goes off, strong winds come up, a low water level occurs, a machine stopping or overheating, or a cold storage unit that is not on temperature. Additionally, it can be a vehicle or animal leaving a predefined area (geofence), etc.
Our devices communicate either through Wi-Fi, GSM, or the latest low-power, low-bandwidth radio technologies – Sigfox and Lora.
Popular solutions
-
Weather Stations -
Water Tank Level Sensors -
Tracking of Vehicles or Assets -
Water Quality Sensors for swimming pools -
Water Quality monitoring on farms / rivers / estuaries -
Electricity and Water Meters -
Temperature and Humidity -
Car park- Available Parking -
Bin Level Sensors -
Electronic Scales or Loadcells
